
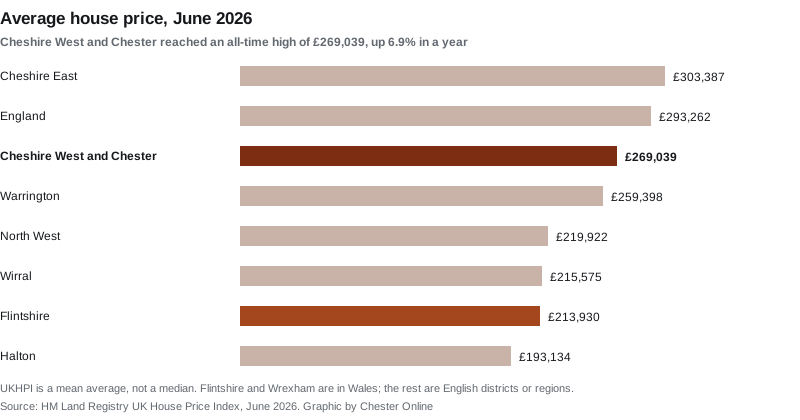
Cheshire West homes rose £17,435 in a year to an all-time high in June, the 32nd fastest rise in England. Over the border in Flintshire, prices moved 1 per cent.
The average home in Cheshire West and Chester sold for £269,039 in June, the highest figure the district has ever recorded. That is up £17,435, or 6.9 per cent, in twelve months, according to the Land Registry’s UK House Price Index, published this week.
The index runs back to January 1995, when the district average was £52,516. June 2026 is the top of it. The previous high was May this year.
England managed 1.8 per cent over the same twelve months. The district is rising almost four times as fast as the country it sits in.
Where that sits nationally
We ranked all 295 English local authority districts on the annual change in the Land Registry’s June 2026 full file. Cheshire West and Chester came 32nd, inside the top ninth of the country.
That is a long way from a national boom. Sixty-two of the 295 districts recorded a fall over the year. Cheshire West is not riding a rising tide; it is one of the places doing the rising.
On price level rather than growth it is squarely mid-table, 177th of 295, and £24,223 below the England average of £293,262.
The neighbours, and the border
The most striking comparison is a few miles west. CH4 postcodes straddle the Welsh border, so plenty of people who work in Chester live in Flintshire.
| Area | June 2026 average | Change over 12 months |
|---|---|---|
| Cheshire East | £303,387 | +5.0% |
| Cheshire West and Chester | £269,039 | +6.9% |
| Warrington | £259,398 | +6.5% |
| Wirral | £215,575 | +7.8% |
| Flintshire | £213,930 | +1.0% |
| Wrexham | £212,502 | +3.4% |
| Halton | £193,134 | +3.7% |
| England | £293,262 | +1.8% |
| North West | £219,922 | +4.7% |
A home in Flintshire now costs £55,109 less than one in Cheshire West on average. A year ago the gap was £39,779, so it has widened by £15,330 in twelve months. For anyone weighing a move across the Dee, that is the number that matters more than either percentage.
Terraces are pulling hardest
The rise is not spread evenly, and the cheaper end of the market is moving fastest:
- Terraced houses: £209,368, up 8.0 per cent, or £15,540
- Semi-detached: £267,395, up 7.8 per cent, or £19,321
- Detached: £437,424, up 6.0 per cent, or £24,626
- Flats: £135,450, up 4.3 per cent, or £5,622
A first-time buyer in the district paid an average of £222,205, up 7.5 per cent on a year ago. Buyers who already own paid £321,869.
The pattern matters more than the ranking. Terraces and semis are the Chester and Ellesmere Port starter market, so the fastest rises are landing precisely on the people with the least room to absorb them. Detached houses added the most in pounds, £24,626, but the smallest proportion.
Read this as a mean, not a typical house
Two cautions, both of which most coverage skips.
UKHPI is a mean average, not a median. A handful of large sales pulls it up, so it is not “what a normal house costs”. It is best used as a direction of travel and a comparison between areas, which is what we have done here.
Every month gets revised. The Land Registry keeps adding completed sales after it first publishes a month. May was first released at £268,449 and an annual change of 5.8 per cent; the June file revises it to £267,609 and 5.5 per cent, a cut of £840. Our own Chester house prices page carried the first figure, and we have now updated it. Expect June’s £269,039 to move a little too when July is published.
Sales volumes lag by about three months and are still distorted by the stamp duty threshold change on 1 April 2025. The district recorded 805 sales in March 2025 against 322 in March 2026, which is a rush to beat a deadline rather than a collapse in demand. April 2026 sales, at 289, were actually up on April 2025’s 259.
What it means for you
If you are selling, the index says the market is with you, but it is a district average covering everywhere from Neston to Winsford. A record borough figure does not mean a record price on your street, and asking prices are not sale prices. Sold-price data for your own postcode is free to search on the Land Registry’s site.
If you are buying, the fastest-rising types are terraced and semi-detached, so waiting is not free at that end. It also means the gap to a detached house has narrowed in percentage terms for the first time in a while.
If you are staying put, your council tax band does not change when prices rise. Bands are still set on values as at 1 April 1991, which is why a £269,039 average and a Band D bill of £2,479.20 are unconnected. Our Chester council tax bands page sets out what each band costs this year.
If you are moving into the area, compare on the same basis or not at all. The town-level averages quoted by estate agents are rolling twelve-month figures for a different geography, and they will not match the index.
Sources
- UK House Price Index, Cheshire West and Chester, June 2026, HM Land Registry
- UK HPI full file, June 2026 (CSV), HM Land Registry, used for the national ranking, the neighbouring districts and the May revision
- UK House Price Index reports, GOV.UK for the methodology, including the mean-average basis and the revision policy
Have your say